
Most of the country is seeing either a slowdown in rent growth or an actual decline. According to Realtor.com’s January 2024 Rental Report, nationwide asking rents for 0-2 bedroom properties declined -0.3% YoY – the sixth month in a row with a year-over-year decline. Meanwhile, CoreLogic reported another month of “slow gains” with a YOY increase of 2.8% for their Single-Family Rent Index in December 2023.
Part of this softening of rent growth is the cooling inflation environment, while another key part is the massive uptick in rental housing supply over the last year (click that link for a deep dive into the supply story). We wanted to investigate supply on the market level to understand which markets have seen the most growth in either multi-family or single-family rentals available and what impact that has on rent rates.
Supply
First, let’s consider supply. We track ‘supply’ by looking at the number of available rentals in a given market since that is a reasonable indicator of the trend at a high level. The chart below shows the number of available rentals for Multi-Family vs. Single-Family in February 2024 compared to February 2023.
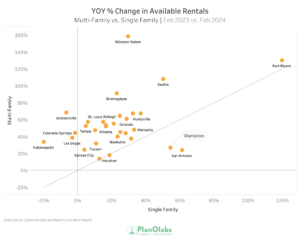
The chart shows a few interesting trends:
- Most markets have seen an increase in available rentals for both Single Family and Multi-Family units, but for a large majority the increase in Multi-Family is much greater
- Cities like San Antonio and Charleston have seen a large increase in single-family rental availability and a more muted increase in Multi-Family rental availability.
- Indianapolis, Las Vegas, Colorado Springs, and Jacksonville all show a decrease in available single-family rentals, but no markets show a decrease in available multi-family rentals.
Demand
Of course there are always two sides to this equation: what about the demand? To include demand in the equation we can look at rent growth over this same time period. If the demand increased then you would expect rent rates to increase with it, while a fall off in demand would likely result in lower rent prices.
The following chart shows the year-over-year rent growth for January 2024, according to Realtor.com, with a map view below it:
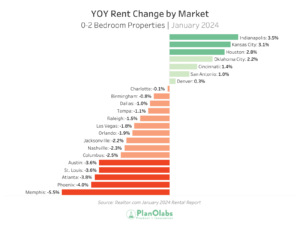
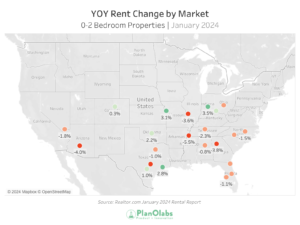
These charts show that only 4 of the markets tracked had a year-over-year rent growth over 2%, with Indianapolis and Kansas City leading the way. All the markets tracked in the Southeast and Florida show a negative trend.
Supply & Demand
Now let’s put it all together. When we overlay the demand (rent price trend) on the supply (available rentals), here is what we see:
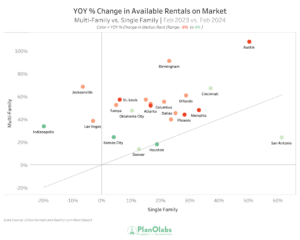
The following markets stick out with an increase in rent price and an increase in available rentals:
- Cincinnati
- San Antonio
- Oklahoma City
- Houston
- Kansas City
- Denver
The ability to increase prices while supply is also increasing tells us there is a strong demand story in these markets.
Summary
- The trend around the country is softening rent growth, with quite a few markets even seeing a decline in rent rates.
- Available multi-family rentals have increased substantially in almost all markets tracked in our sample, while single-family rentals have seen a more muted increase.
- Zero markets tracked saw a decrease in available multi-family rentals, while four of the markets saw a decrease in available single-family rentals.
- Six markets in the sample had an increase in both the rent rate and the available rental supply, signaling strong demand in those markets.